How fresh is OSM in terms of stop sign detections?

Is OSM data about stop signs fresh and conclusive, or does it require some additional work? We asked this question after reading ״How Lyft discovered OpenStreetMap is the Freshest Map for Rideshare”, which covered OSM’s road class, directionality and lane metadata. We wanted to add our insights on OSM’s freshness with regards to the one of the main signs that OSM tracks: stop signs.
Lyft’s original study concluded that OpenStreetMap has “a very high quality road network in 30 large North American cities”. Specifically, Lyft’s mapping group chose spatial clusters and applied remote sensing to determine whether the map reflects ground truth. It found that in the 30 cities it checked, OSM data’s accuracy for road class and directionality was estimated to be larger than 95%, while lane metadata were less accurate and more heterogeneous across regions.
We decided to run a similar check with regards to stop sign data in one of these cities, in a specific spatial cluster in Seattle. We chose Seattle for two reasons. The first was that it ranked pretty high in Lyft’s measurements of OSM accuracy. It also is a city in which Nexar’s coverage is “average” (in terms of dash cam imagery coverage, see below), so we felt it would give a good sense of the state of affairs.
Survey Design
For remote sensing of the road signs we used Nexar’s home-grown crowd-sourced vision network. Nexar is the US’s leading provider of smart dash cams, and these dash cams provide a steady stream of fresh images from the road. We applied detections of stop signs over them to “see” how many stop signs are in that area in that specific part of Seattle. For each of Nexar’s detections, we could quickly review the associated images and immediately validate whether it was a true or false detection. In terms of freshness, we know that most of our imagery is anything from several hours old to months old. How fresher is it compared to Google Street View, we do not know (and the same applies to the mapillary data used by lyft in the blog), but we can provide an estimate. For instance, when comparing images of all US locations of McDonalds, Nexar images were 19 months fresher on average, compared to Google Street View, Given that Nexar dash cams “see” 130 millions miles a month, you can imagine that produces quite a lot of imagery and stop sign detections.
What we did
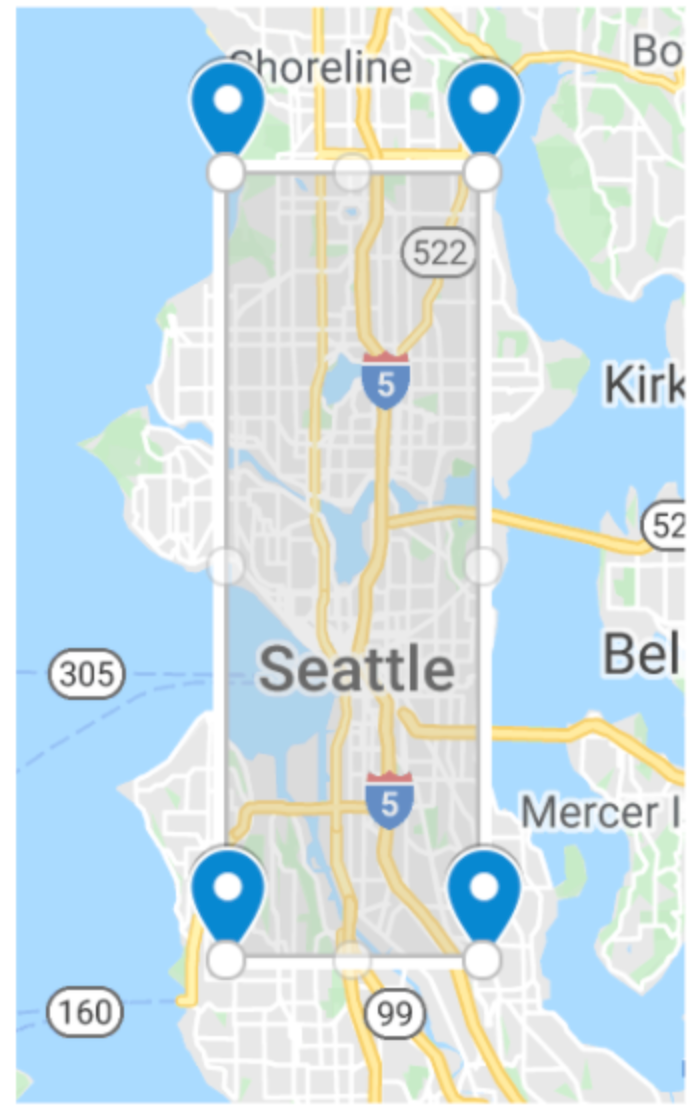
We focused on an area in Seattle, with the following coordinates: 47.533677, -122.380981, 47.729746, -122.286442

Then we annotated the 1266 stop signs appearing in OSM. These signs were verified using Google Street View, which was no easy feat, since you need to start “looking around” with the cursors until you can see the sign.
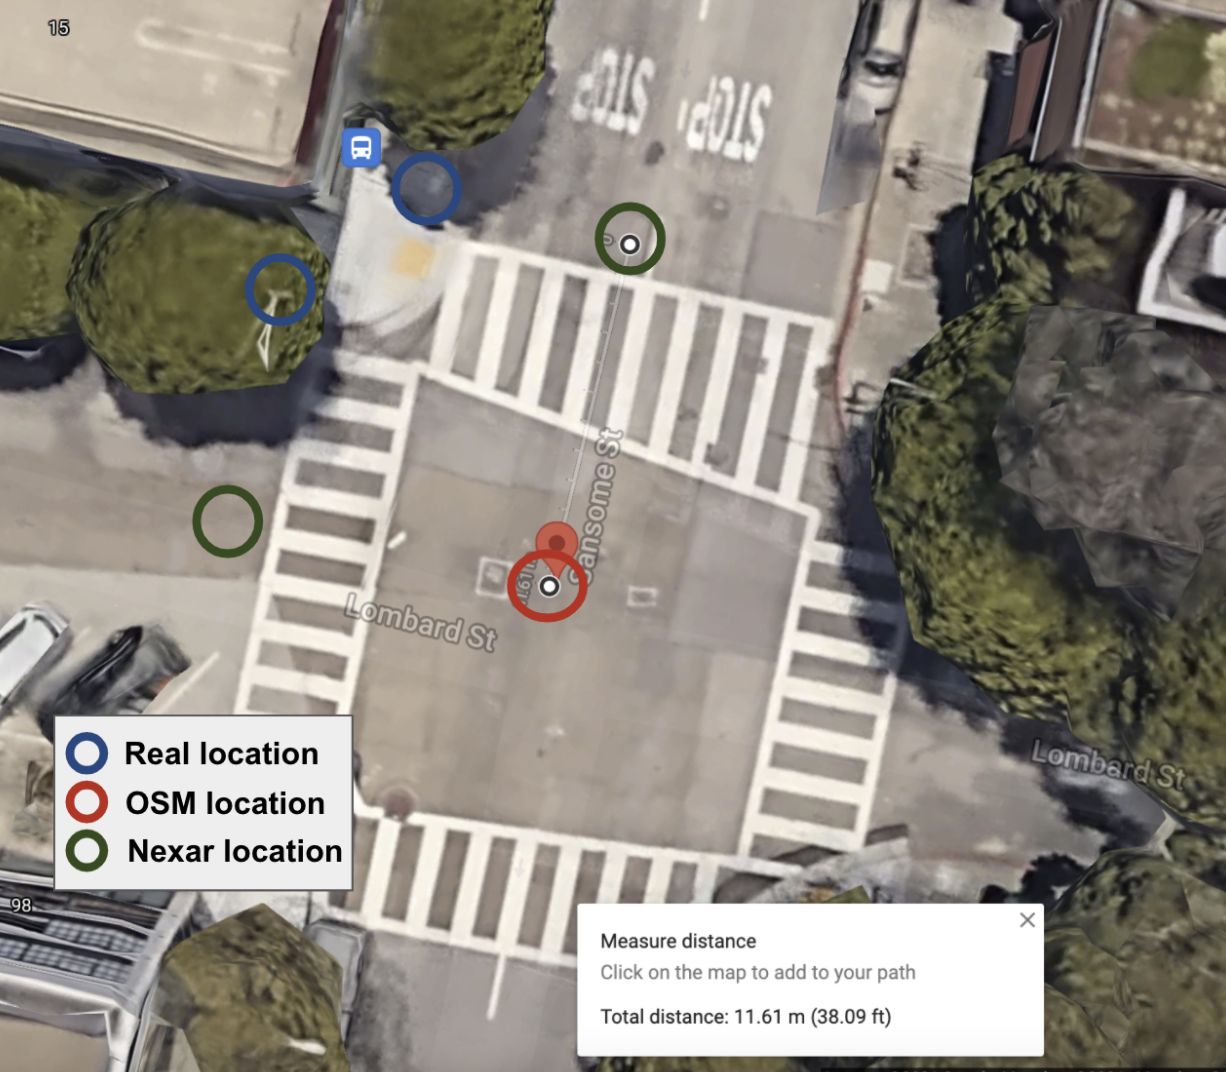
To understand the process, the following image shows how stop signs appear in each of Nexar, OSM and real life:

The real location of a stop sign appears in blue. Its location determines the lanes/driving directions the sign affects. In Nexar’s data the location of the sign can be verified visually, but the sign would appear in the middle of the lane it affects. In OSM the sign appears in the middle of the intersection. As a result, verifying OSM data required looking at Google Street View images and “looking around” since there was no hint about where the stop sign may appear. With Nexar’s CityStream, this verification process is much simpler, since you could just pull the underlying image in Nexar’s CityStream platform, which showed both the detection and the underlying image itself.
We then filtered for false positives: cases where there was a detection (or OSM indication of) a stop sign, but the visual evidence proved otherwise.
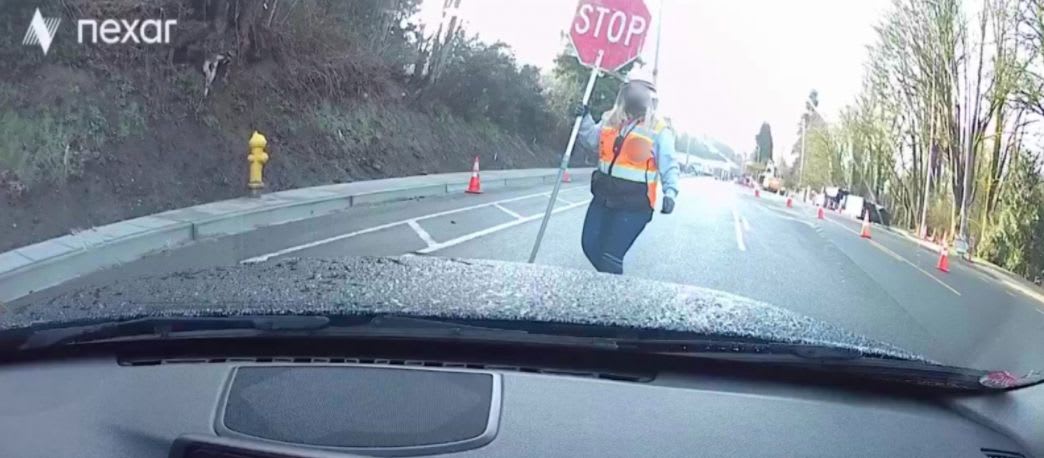
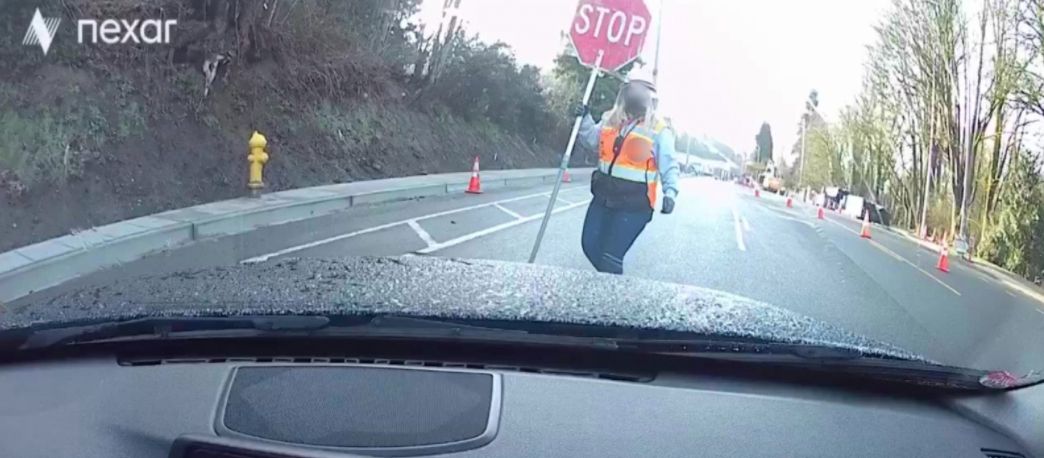
On the Nexar side, some false detections were a result of objects that look like stop signs (“do not enter” signs) as well as “temporary detections” (0.49%) which are essentially a human holding up a mobile sign, like here:

Given our analysis, we estimate that there is a total of 2320 signs detected by both or one of OSM and Nexar, of which 49% appear in OSM. This isn’t as good a result as that in the Lyft study quoted above, but it can be remedied with remote sensing technologies such as Nexar’s.


