ebook
Leverage Nexar’s collision and near-collision data, driver behavioral maps, change detection, mapping and safety data for AV success
The world as it is, ready for training
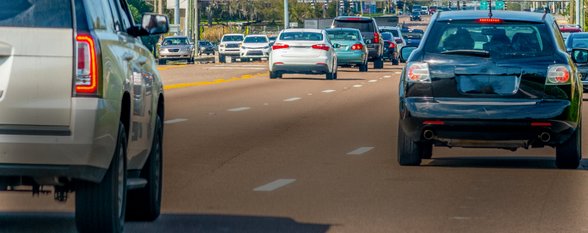
Nexar collects data from 200 Million Miles driven monthly, adding to a dataset of 32 million corner case videos. This imagery translates into valuable information for AV training, using various driving events such as hard brakes, collisions, near-misses, and other edge cases - all for improving your model’s performance and safety.
Accurate and fresh map data for AVs
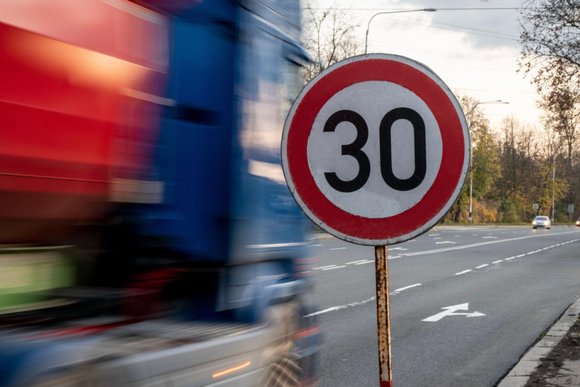
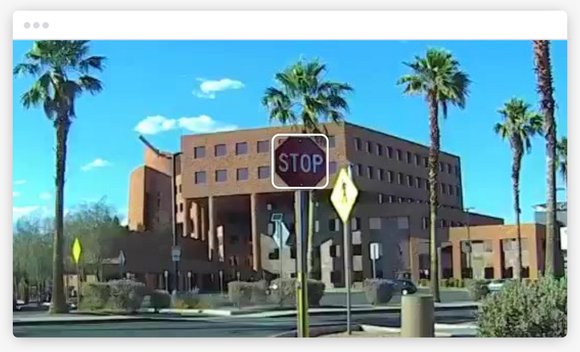
Nexar’s extensive dash cam network maps transient road elements such as work zones, road sign change detection and speed limits. It then assists you to fill in the accurate map data you need - at scale and on time, with the required visual verification.
Scenario reconstruction to benchmark incidents
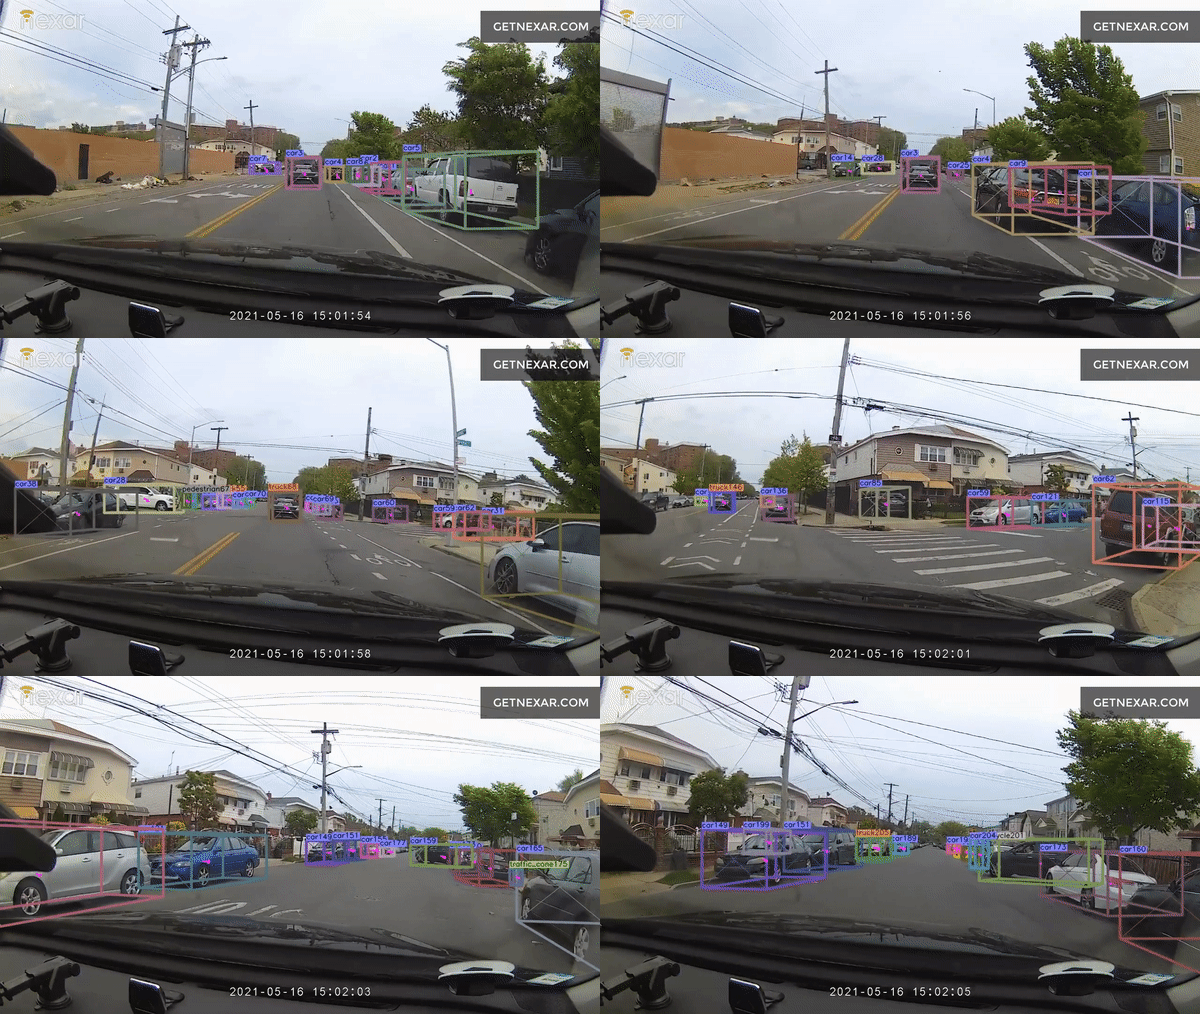
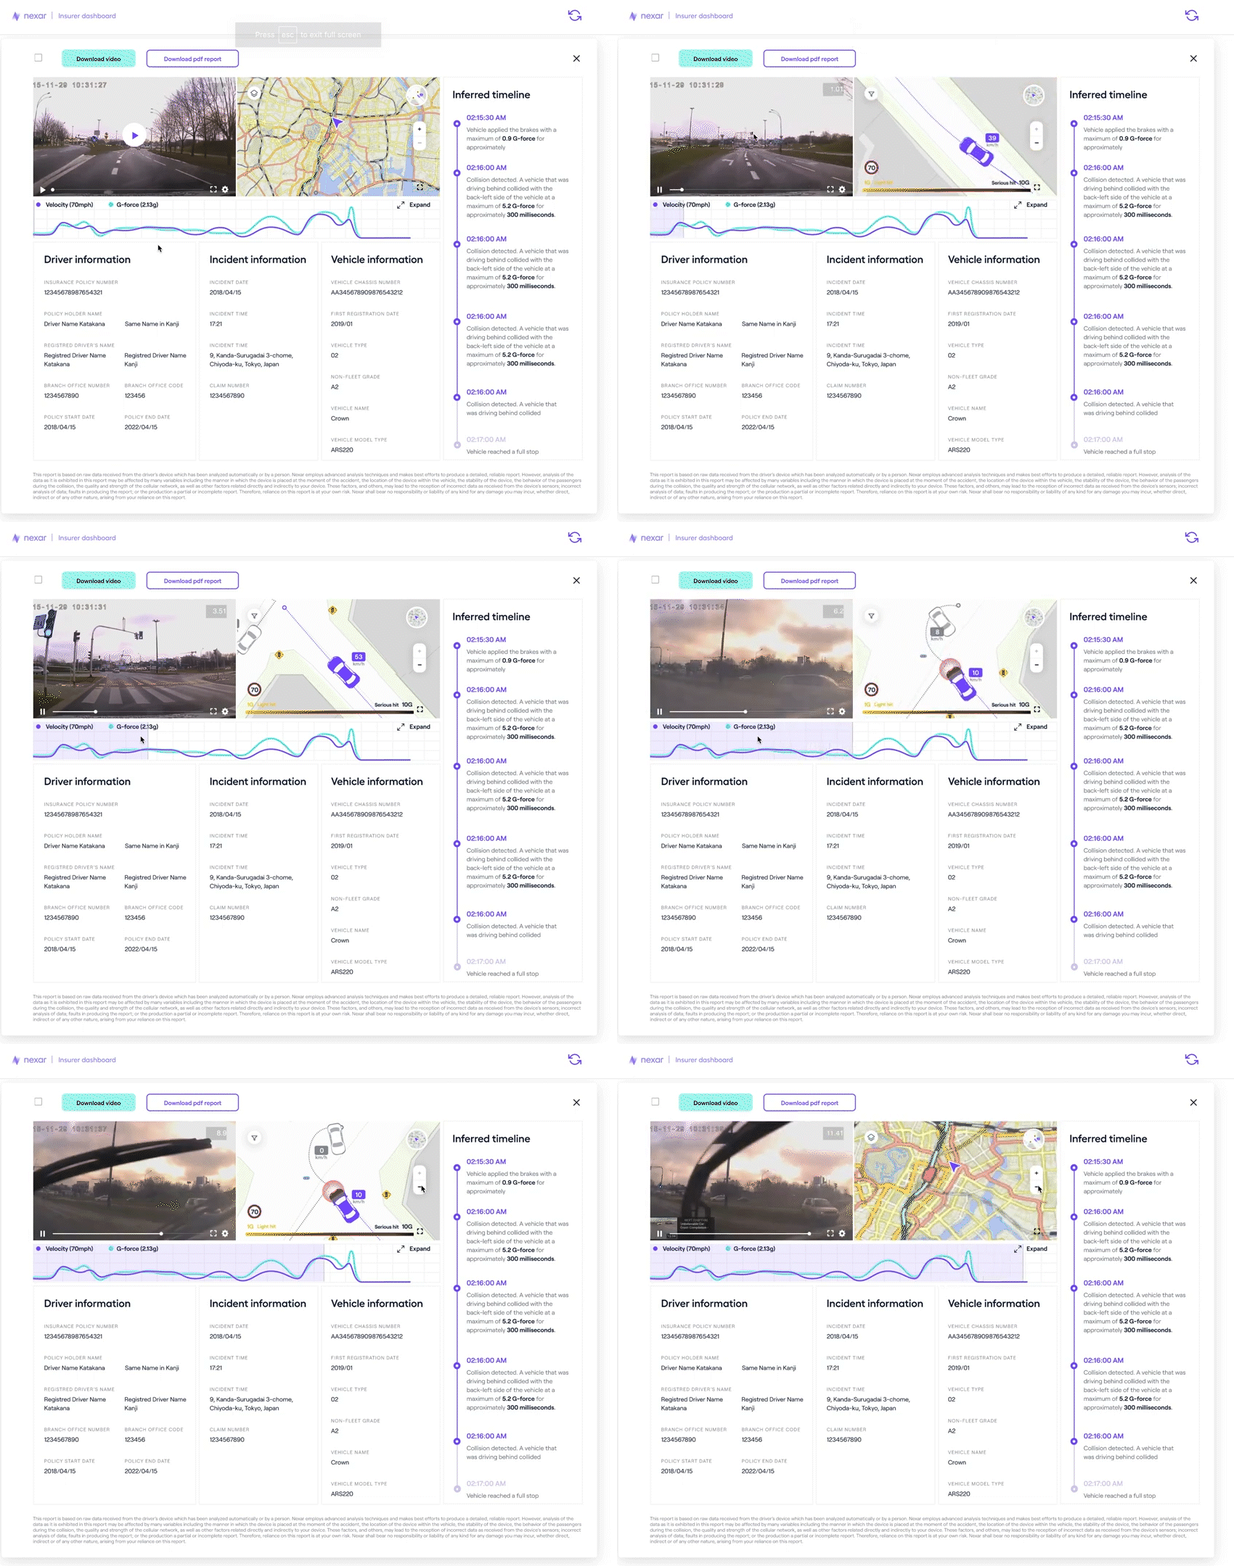
Nexar produces corner case scenarios for simulation, using 3D reconstruction on top of collision and near-collision data. This data includes full 1st party and 3rd party reconstruction, as well as raw data (such as geo-location and timestamps) and additional insights for training outcomes.
The ultimate goal is to reach Vision Zero - a collision-free world.
Driver Behavioral Maps
Nexar’s Vehicle Behavioral Maps offers a valuable record of how other vehicles drive in the same road segments. It enables AV companies to better understand, measure, and benchmark safety-related behavior (stop lines, school zones, etc), as well as drive better based on road conditions, visibility, and more. By showing human behavior per road segment and overlaying it on a map, AVs can know where a lane change is common practice or where deceleration is taking place when cornering. This rich, nuanced, analytical evidence is a game changer for AVs, improving autonomous vehicle driving behavior and humanizing driving.
Nexar dash cams “see” them all
- Actual driving cases like hard brakes, high and low-impact collisions, near-misses, cornering, lane drift, positional information, and other edge cases reflecting the ground truth in a given city.
- Varying scenarios, including, different road segments, driver types, vehicle types, and other road conditions.
- Real-world changes that need to be mapped for AVs, such as construction zones, stop lines, school zones, road sign changes, road blockages, and more.
- Diverse data across time (days, weeks, or months) and driver types (consumer, commercial). This includes difficult weather, geo-location, and additional variables.