
Nexar Mobility Report (V2)


A few weeks ago we published our first mobility report. We’re back with more interesting data!
To download the entire report please go here
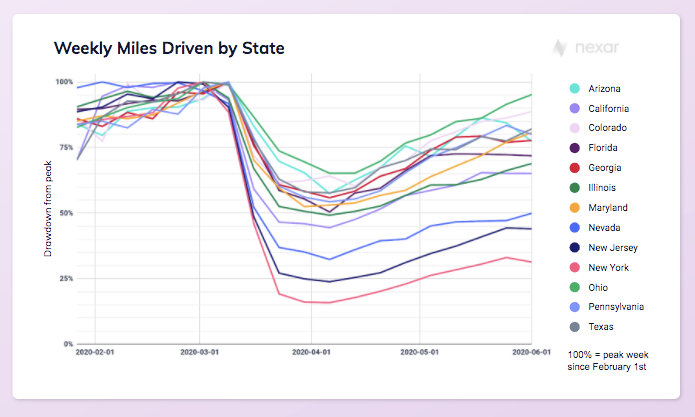
The increase in driving activity across our US network since mid-May is clearly supportive of an economic reopening story.
That said, the “return to normalcy” has diverged meaningfully on a state-level. While Ohio and Colorado are nearing a full recovery from the COVID-induced shutdown, New York and Nevada remain well below pre-COVID levels.
Driving activity seems to be highly correlated with the growth in new infections by state. To illustrate this, we see much stronger 2-week trends in early hotspots (even despite protests), in comparison to emerging hotspots like Arizona & Florida. We’ll continue to monitor this relationship, especially as investors, businesses and consumers react to a potential “Second Wave” of the virus.
Our network produces visual data as well. We were able to capture many powerful images of on-going social unrest in recent weeks — https://getnexar.com/virtualcam.
Contact Us
For more information about Nexar’s data products visit: https://getnexar.com/citystream
Jack Killea, Data Sales Director:
jack.killea@getnexar.com
To download the entire report please go here.