
Behavioral Maps: How Real-Time Driving Patterns are Uncovering the Actual Rules of the Road

Based on Nexar's extensive network of dash cams equipped with motion sensors and edge-AI, our research created detailed and constantly updating behavioral maps.
As cars become increasingly automated, they often struggle when their expectations based on maps don’t match the hard reality of the road. At Nexar, we believe that the solution is a paradigm shift in mapping in which behavioral data is fused with live visual evidence to create a real-time snapshot of road conditions as they are experienced by drivers. Nexar’s extensive network of dash cams spread throughout the world, equipped with motion sensors and AI models running on the edge allows for detailed and constantly updating road information.
Is there a virtual crosswalk in an area where there are no markings on the road? Are there places where there is a complete disregard for speed limits or other road rules? Are cars ignoring lane markings due to obstructions such as construction cones or double-parked vehicles?
These are some of the questions that Nexar’s behavioral maps can answer in real time.
Interested in learning more about Nexar's solution?
Schedule a demo now!

Automated Cars Need Behavioral Data from Roads
As automated driving technology continues making its way into more car models and inches closer to full automation, it continues to face many challenges on our roads. When leaving the computer simulations to enter real-world environments filled with drivers, cyclists, pedestrians and unforeseeable events, autonomous vehicles (AV) fail to meet the high road safety standards they set and continue to be a big source of frustration for other road users.
One main reason for this is that AVs only have access to the visible data in their immediate surroundings lacking foresight and vision beyond obstructions. The maps they rely on are often outdated and describe the strict road rules as defined by signs and regulations but lack any information on how drivers actually use the road.
Due to these shortcomings, robotaxis still cause traffic incidents in innocuous situations [1]. Understanding how other road users behave on the road is crucial to preventing AV accidents and for better anticipating the behavior of others. In addition, robotaxis’ robotic behaviors give off puzzling cues to other drivers and pedestrians. They are notoriously bad at making unprotected left turns and frequently make erratic counter-intuitive maneuvers [2]. Recently, safety regulators began investigating self-driving cars for “inappropriately hard braking” or becoming “immobilized while operating” [3]. It is becoming increasingly evident that there is a need for AVs to better replicate human driving behaviors to better assimilate into the road and provide more comfort and peace of mind for their passengers.
Even lower levels of vehicle automation face challenges due to a lack of real-time behavioral information. Driver assistance systems (ADAS) and partial automation still require drivers to be aware at all times due to the car’s inability to foresee dangers and alert the driver with enough leeway to take back control. Access to real-time behavioral maps could help these cars better warn drivers to take over with enough time to spare. As well, lane-keep and automatic braking features in ADAS often contradict how the road is actually being used when construction zones and stopped vehicles alter the drivable paths of the road and sudden intrusions give reasons to anticipate hard braking. Behavioral maps could unlock wider usability of ADAS features in these unconventional cases.

Leveraging the Power of Nexar’s Network
Nexar’s expansive real-time network of users provides a detailed picture of road behavior across cities all over the United States. Nexar dash cams come equipped with GPS receivers that help users track their rides and an accelerometer for accident and hard brake detection. At Nexar, we anonymously aggregate all this motion data to create our behavioral maps. Combined with the multitude of visual evidence and our AI models that run on the edge, Nexar is able to get a multi-modal picture of what is happening on the road. Nexar’s users also vary widely ranging from regular everyday users to professional drivers such as taxis and delivery people. With hundreds of thousands of users, we are able to paint a detailed and statistically significant picture of driving behavior on roads throughout the United States.
All this data comes together to produce a crowdsourced real-time map of the actual road rules as experienced by drivers. These include
- Effective Speed Limits: where drivers typically drive significantly below or above the speed limit. Examples can be seen in figures 5 and 7.
- Effective Turning Lanes: When drivers are overwhelmingly choosing to turn at an intersection.
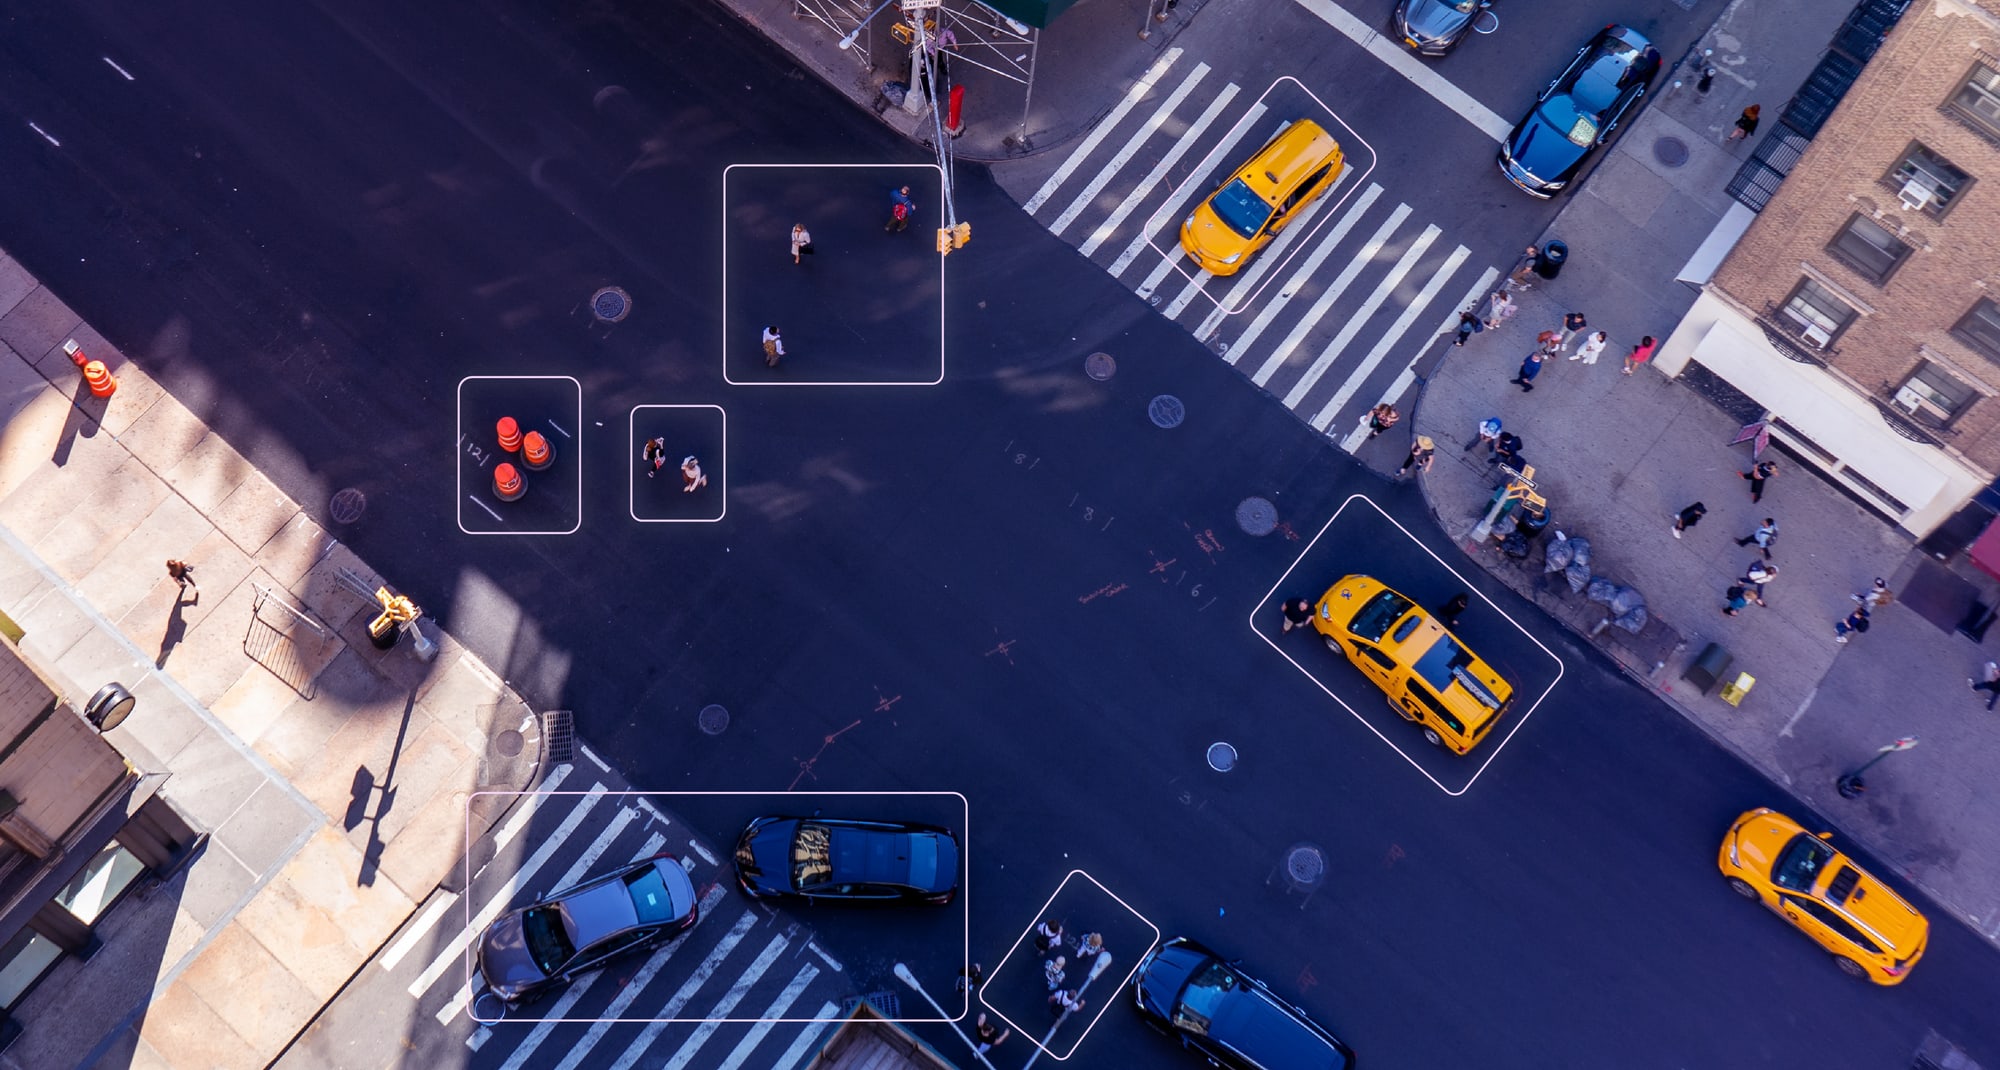
- Virtual Stop-Lines and Virtual Cross Walks: When certain obstacles or common jay-walking occurs on a segment, many more decelerations and full stops will be observed in the behavioral map distribution. This is corroborated by AI detectors that differentiate between the different scenarios and provide explainability. Examples of these can be seen in figures 2 & 3.
- High-Risk Roads: Areas with higher risk for an accident and vigilance is required such as frequent hard brakes as in figure 1 or where cutting off is common.
- Effective School Zones: Areas around schools behave completely differently during drop-off and pick-up times compared to the rest of the day and weekends. Although school zones are typically marked, the norms and behaviors are highly variable between schools and highly dependent on the time of day.
We can also leverage Nexar’s visual data to generate situation-based behavioral datasets such as behavior when:
- Around Emergency Vehicles and Law Enforcement: Visual and audio information allows us to segment when emergency vehicles and law enforcement are present and how it affects the drivers in the vicinity.
- Faced with lane blockers such as double parkers, construction zones and obstacles: Effective lanes and driver behavior change in these temporary situations where only a constantly updating map could provide insight.

Data at High Road Resolution
In this article, we will describe how Nexar’s large-scale motion data is processed to produce multiple elements of the behavioral maps. The first step in this process is to faithfully attribute this motion signal data from rides to the road segments on which they occurred. This is done through Nexar’s in-house map-matching algorithm which associates a raw GPS signal to roads on a base layer map by taking into account the geography and topology of the road as well as the ride history.
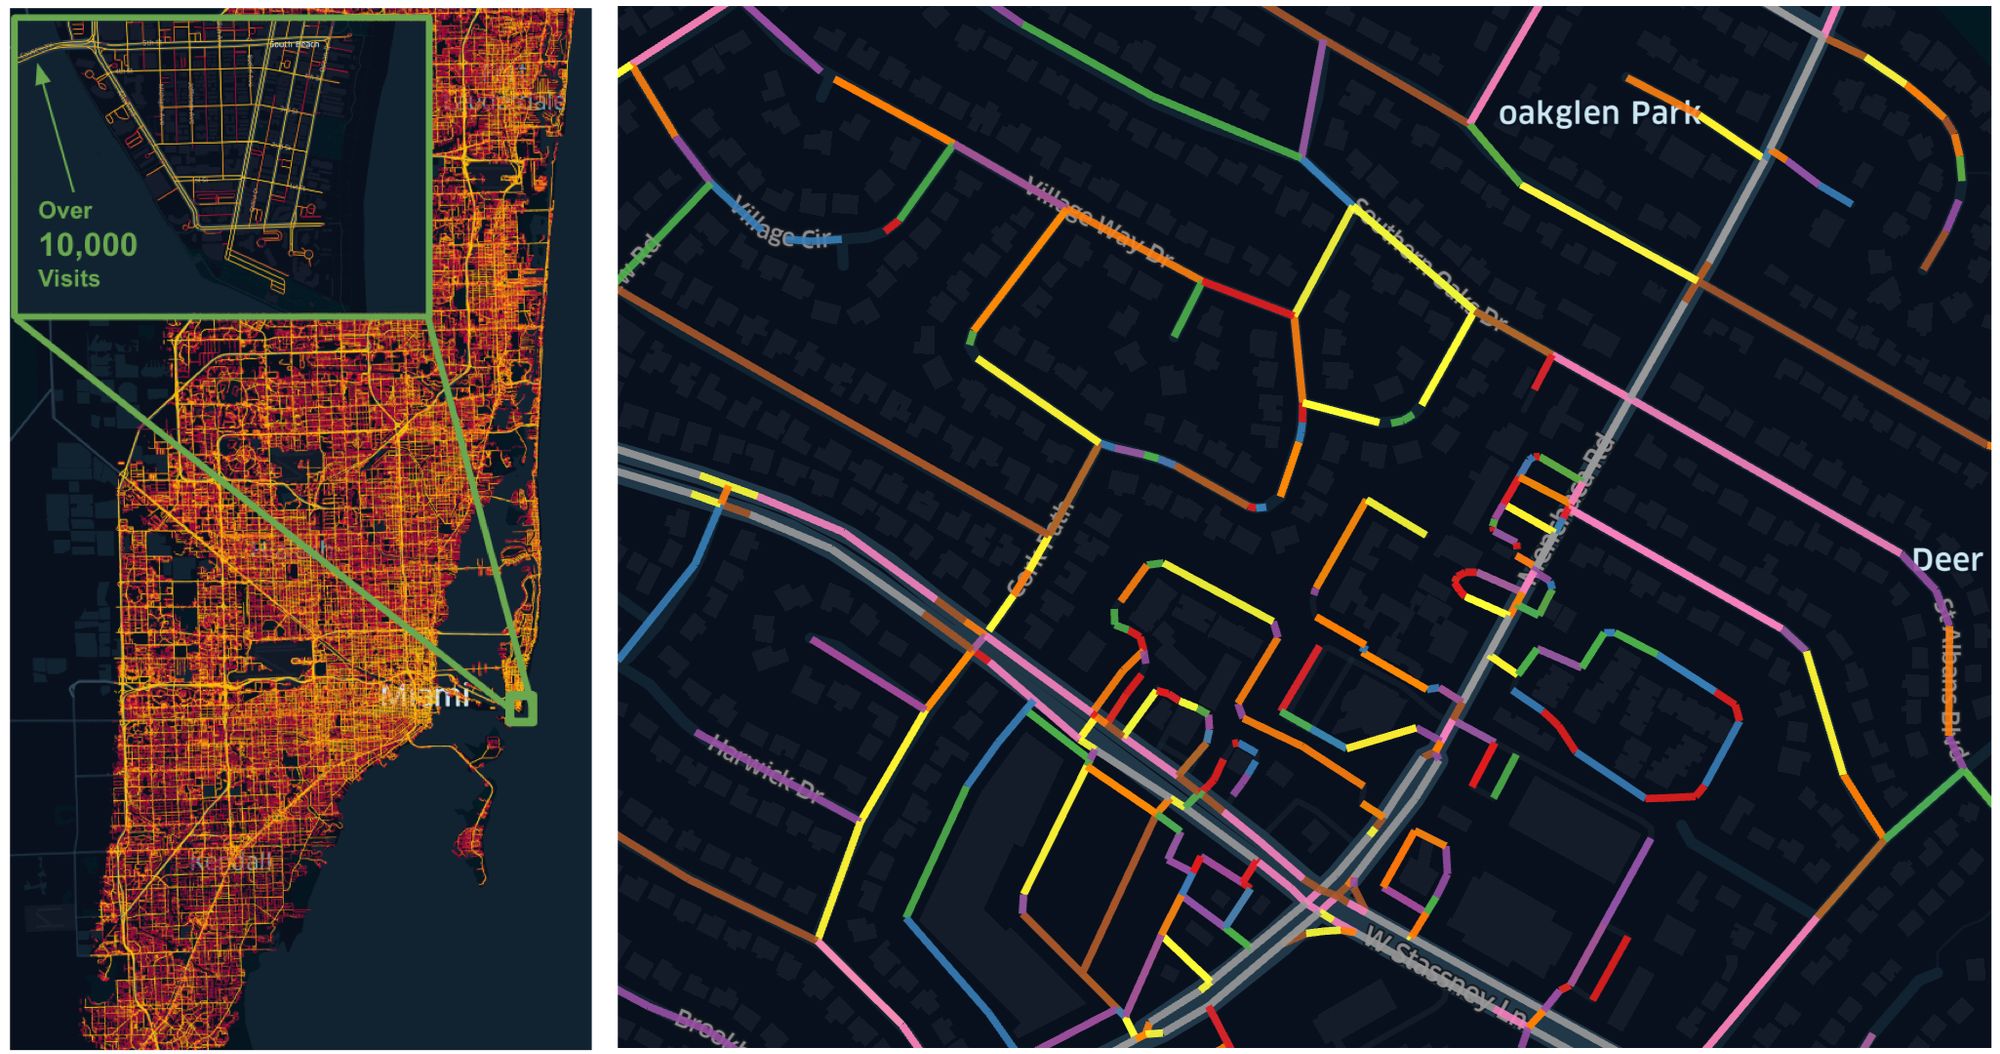
The road segmentation for which behavioral statistics is provided come in a range of sizes varying based on the semantic resolution needed in each case. Typically they will be shorter in crucial places such as curves, intersections, and residential roads where there is a larger variation in driving behavior. A map showing an example of how we break roads apart can be seen in figure 4.
We also leverage Nexar’s extensive data to provide separate statistics for each driving direction for every individual road segment. This road segmentation results in an adaptive resolution of location-based statistics giving a high definition of behavioral mapping in locations with high sensitivity while still retaining well-proportioned sizing in other places.
What Kind of Statistics are Provided
Nexar dash cams' inertial measurement units (IMU) measure acceleration in three directions to provide insight into the motion related to braking and accelerating (longitudinal), turning (lateral) and vertical. Once the signal data is collected for each segment, the accelerometer data is cleaned using a low pass filter to remove very high-frequency noise in the signal as well as a high pass filter to remove the gravitational element in the signal data. The vehicle speed is extracted from the measurements made by the GNSS receiver.
With the cleaned and collected data, we could compute the various elements of the behavioral dataset. The metrics in this dataset includes:
- Miles: aggregated miles driven on a segment is computed to provide a necessary normalization for the road statistics
- Speed: The distribution of time spent at different speeds ranging from 0mph-100mph for each road segment.
- Acceleration: the rate of change at which drivers change speed gives information about braking and acceleration probabilities for a segment as well as lane change preferences and turning characteristics.
- Jerk: the rate of change (time derivative) of the acceleration tell us how quickly drivers accelerate or whether hard brakes are common and other sudden events occur
The acceleration and jerk statistics are provided separately for all 3 directions mentioned above.
One example of speed insights from behavioral maps is on a road segment on the Florida Turnpike, Nexar’s data showed that 89% of the time, drivers are going an average of 10 mph over the speed limit of 70 mph. 6% of the time, people are driving above 90 mph!


As well, lateral acceleration statistics near a highway exit showed increased probability for sudden lane changes which could help ADAS and AVs better predict when human drivers may act erratically. Another isnight from looking at longitudinal jerk statistics, was that over the whole city of Miami, regular drivers have a more than 50% higher chance to make a hard brake than a professional driver.
Road Behavior changes at different times
The resulting data for each dataset is then aggregated and segmented over different time periods to provide the ability to get insights into how human behavior changes on a road at different times. This gives us the ability to look at behavior based on year, month, day of the week, hour of the day and outdoor lighting conditions (calculated for each time and location).
One example of this is a road segment we looked at in Austin where the speed distribution took a different form at rush hour times where a different bumper-to-bumper traffic speed of 17mph was observed far from the typical 65mph speed limit.


A Paradigm Shift in Road Mapping

The high resolution and rich segmentation of Nexar’s Behavioral Maps open up new capabilities in allowing AVs to better anticipate road circumstances and to respond more naturally.
The vast coverage of Nexar’s Behavioral Maps allows AV makers to enter new cities anywhere in the U.S. better prepared for the different road norms among cities.
The multiple scales of time segmentation give AVs the ability to differentiate between daytime and nighttime driving behaviors or how in highly seasonal cities, winter and summer driving patterns can vary widely. Furthermore, behavioral maps are updated in real-time, providing the most current information to autonomous vehicles.
Overall, behavioral data is an essential component of the development of autonomous vehicles. By using this data, developers can create algorithms that enable autonomous vehicles to better understand and interact with their environment, improving safety and performance. This window into the conscious and subconscious behaviors of drivers will help drive AV safety standards forward and unlock more use cases for ADAS.
As autonomous technology continues to advance, the importance of behavioral maps will only continue to grow. Nexar’s constantly updating behavioral maps are a paradigm shift in how we map our network of roads and are a better fit than traditional maps for an automated future. It is inevitable that all cars will one day adopt live evidence-based behavioral maps to navigate our roads into a safer future.
For a more in depth read about the analysis and algorithms involved, continue reading here.
Get a demo here: https://data.getnexar.com/solution/vehicle-behavioral-maps/
Citations
- Bote, Joshua. “Waymo driverless car brings San Francisco traffic to a halt during rush hour.” SFGate, 24 Jan. 2023, www.sfgate.com/bayarea/article/waymo-rush-hour-traffic-standstill-17739556.php.
- Metz, Cade, et al. “What Riding in a Self-Driving Tesla Tells Us About the Future of Autonomy.” The New York Times, 14 Nov. 2022, www.nytimes.com/interactive/2022/11/14/technology/tesla-self-driving-flaws.html.
- Wayland, Michael. “U.S. safety regulators investigating GM’s Cruise robotaxis blocking traffic, causing collisions.” CNBC, 16 Dec. 2022, www.cnbc.com/2022/12/16/us-safety-regulators-probe-gms-cruise-self-driving-cars.html.